I had done a visualisation using R, where I plotted the locations of my friends and followers on Twitter on a map. I re-did this visualisation using D3.js. It is a fantastic visualisation tool, which a lot of features. I could only explore a fraction of the API for my purpose, but you can see a lot of cool examples on their page.
The final output was something like this (a better look here):
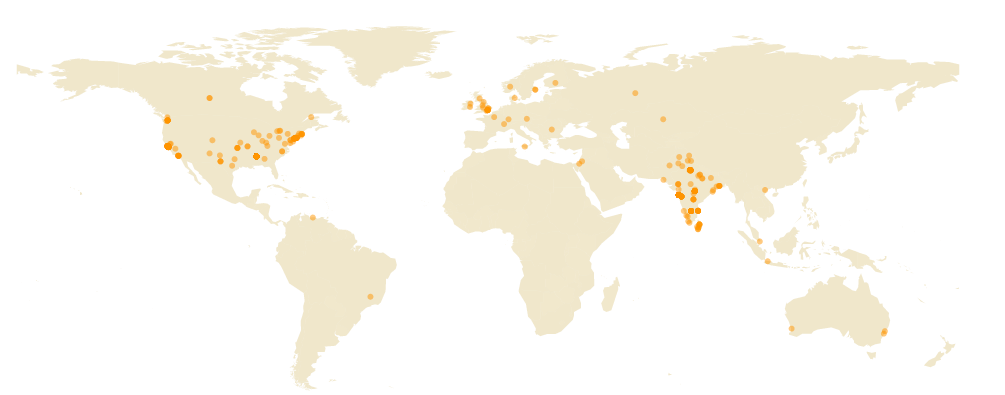
I wanted to resize the bubbles when there are a lot of points in the vicinity, but I’ll leave that for later.
You can have a look at the D3.js code, and the python script which gets the lat-long pairs using the Twitter API, and the Google GeoCoding API (Yahoo! decided to commercialize their GeoCoding API sadly).
(The map data and some inspiration for the code, is from here)